Setting up the AWS Distro for OpenTelemetry (ADOT) on EKS looks like a three-command job. Install the addon, drop in a collector config, point some telemetry at it. Done.
In practice, between "install the addon" and "I can see a trace in X-Ray," I walked into four separate walls — a missing prerequisite the addon won't install for you, a CRD schema change that silently rejects the config everyone copy-pastes, a Kubernetes scheduling failure that has nothing to do with CPU, and an ASG ceiling that blocked the fix.
None of these are hard once you know them. All of them cost you twenty minutes if you don't. This post walks the whole path end to end, in the order the failures actually happen, so you can sidestep every one.
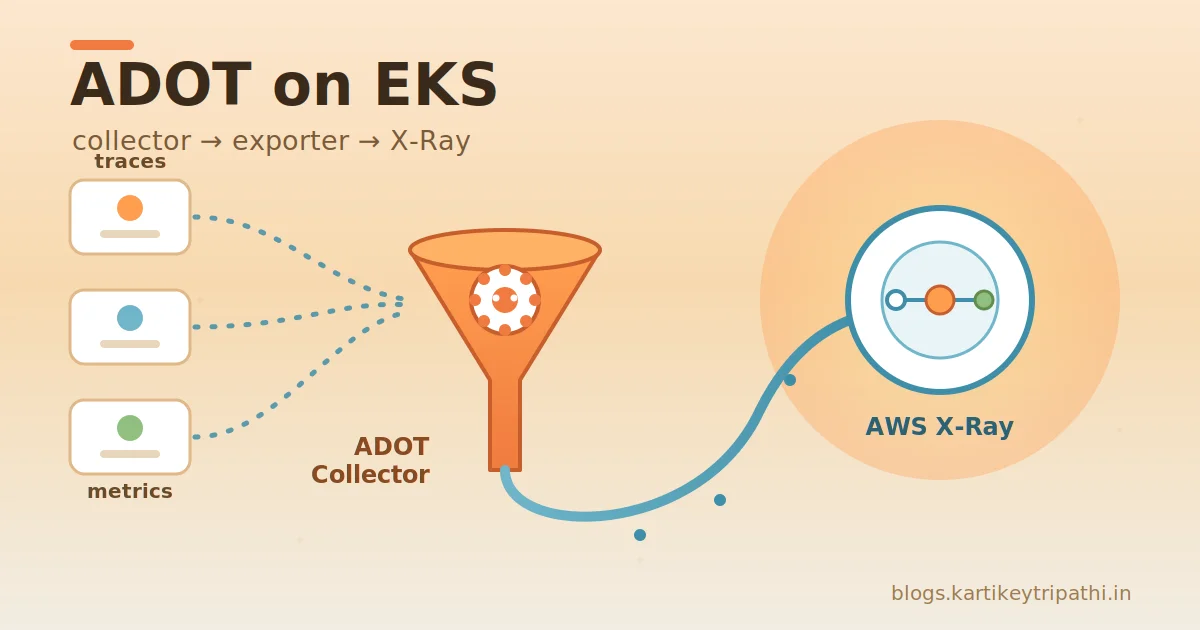
By the end we'll have telemetry flowing:
telemetrygen → OTLP gRPC :4317 → ADOT Collector → awsxray exporter → X-Ray ✅
The setup
- An existing EKS cluster (mine:
my-cluster,us-east-1, single managed nodegroup) eksctl,kubectl, and AWS CLI configured- Goal: install the ADOT addon, run a collector with receivers/processors/exporters, and prove data lands in AWS — not just assume it does
Step 1 — Install the ADOT addon (and meet the version wall)
First instinct: pin a version and create the addon.
aws eks create-addon \
  --addon-name adot \
  --addon-version v0.45.0-eksbuild.1 \
  --cluster-name my-cluster
An error occurred (InvalidParameterException) when calling the CreateAddon
operation: Addon version specified is not supported
The version string I grabbed wasn't valid for my cluster's Kubernetes version. Addon versions are tied to the control-plane minor version, so never hard-code one from a blog (including this one). Ask the API what's actually supported:
aws eks describe-addon-versions \
  --addon-name adot \
  --kubernetes-version 1.31 \
  --query 'addons[].addonVersions[].addonVersion' \
  --output table
Swap 1.31 for your cluster's version, then create the addon with a version it actually returns.
Side note worth catching: the error's "Additional error details" block printed
clusterName: adotandaddonName: my-cluster— swapped. That's AWS mislabeling its own echo, not a bug in your command. The real problem was purely the version string. Don't go chasing a phantom naming issue.
Step 2 — The prerequisite the addon won't install for you
With a valid version, the next failure:
cert-manager is not installed on this cluster. During preview, you are
required to have previously installed cert-manager.
The ADOT operator uses cert-manager to provision the TLS certs for its admission webhook. The addon does not bundle it, and it won't install it for you. You install it first, separately:
kubectl apply -f https://github.com/cert-manager/cert-manager/releases/download/v1.16.2/cert-manager.yaml
Then wait — this is the part people rush. All three cert-manager pods must be Running and Ready 1/1:
kubectl get pods -n cert-manager -w
You're waiting on cert-manager, cert-manager-cainjector, and cert-manager-webhook. Once they're all ready, give the webhook another 30–60 seconds before creating the addon — the webhook needs to be reachable, not just scheduled, or addon creation can still fail.
Private-cluster trap: if your cluster is fully private, the cert-manager webhook port (
9443) has to be allowed in the node-to-control-plane security group rules, or admission calls time out and the install hangs with no obvious cause.
Now the addon creates cleanly:
aws eks create-addon \
  --cluster-name my-cluster \
  --addon-name adot \
  --addon-version <supported-version>
Step 3 — The collector config that everyone copy-pastes (and why it's rejected)
The ADOT addon installs the OpenTelemetry Operator, which watches OpenTelemetryCollector custom resources. You describe what you want — receivers, processors, exporters — and the operator runs a collector for you.
Here's the config I wanted: OTLP in, batch + memory_limiter processing, and three exporters — awsemf (metrics → CloudWatch), awsxray (traces → X-Ray), and debug for sanity-checking the pipeline.
I applied it the way every older tutorial shows — apiVersion: opentelemetry.io/v1alpha1 with config: | as a literal YAML string. The webhook said no:
Error from server: admission webhook "mopentelemetrycollectorbeta.kb.io"
denied the request: json: cannot unmarshal string into Go struct field
OpenTelemetryCollectorSpec.spec.config of type v1beta1.Config
This is the single biggest gotcha in the whole process. Newer operator versions default to the v1beta1 API, and in v1beta1 the spec.config field changed from a YAML string to a structured object. That config: | literal-block style is exactly what breaks. The webhook tries to convert your v1alpha1 string into a v1beta1 object and fails on the unmarshal.
The fix: use v1beta1 and drop the | so config becomes a real YAML map.
cat << EOF | kubectl apply -f -
apiVersion: opentelemetry.io/v1beta1
kind: OpenTelemetryCollector
metadata:
  name: adot
  namespace: adot
spec:
  mode: deployment
  serviceAccount: adot-collector
  config:
    receivers:
      otlp:
        protocols:
          grpc:
            endpoint: 0.0.0.0:4317
          http:
            endpoint: 0.0.0.0:4318
    processors:
      batch:
        timeout: 60s
      memory_limiter:
        check_interval: 1s
        limit_percentage: 75
        spike_limit_percentage: 20
    exporters:
      awsemf:
        namespace: ADOT/EKS
        region: us-east-1
        log_group_name: '/metrics/adot'
      awsxray:
        region: us-east-1
      debug:
        verbosity: detailed
    service:
      pipelines:
        metrics:
          receivers: [otlp]
          processors: [memory_limiter, batch]
          exporters: [awsemf, debug]
        traces:
          receivers: [otlp]
          processors: [memory_limiter, batch]
          exporters: [awsxray, debug]
EOF
The two changes that matter: apiVersion: opentelemetry.io/v1beta1, and config: with no |, with the whole config body indented one level beneath it.
One behavioral consequence of v1beta1: the structured config is validated more strictly. A malformed receiver/processor/exporter key gets rejected by the webhook at apply time, rather than slipping through and failing later in the pod logs. That's actually a feature — errors surface immediately.
Quick heredoc aside
While we're here — the pipe-to-stdin pattern needs the -f -, both parts:
cat << EOF | kubectl apply -f -
kubectl apply -f - tells kubectl to read the manifest from stdin; cat << EOF ... EOF is the heredoc feeding it. kubectl apply - on its own is invalid — apply needs -f to know it's getting a stream.
Step 4 — IRSA: giving the collector permission to export
Before the collector can write to X-Ray or CloudWatch, its ServiceAccount needs AWS permissions via IRSA (IAM Roles for Service Accounts). The serviceAccount: adot-collector in the config above refers to this:
eksctl create iamserviceaccount \
  --name adot-collector \
  --namespace adot \
  --cluster my-cluster \
  --attach-policy-arn arn:aws:iam::aws:policy/CloudWatchAgentServerPolicy \
  --attach-policy-arn arn:aws:iam::aws:policy/AWSXrayWriteOnlyAccess \
  --approve \
  --override-existing-serviceaccounts
CloudWatchAgentServerPolicy covers the EMF metrics export; AWSXrayWriteOnlyAccess covers traces. You can confirm the SA actually got annotated with a role ARN:
kubectl get sa adot-collector -n adot \
  -o jsonpath='{.metadata.annotations.eks\.amazonaws\.com/role-arn}'; echo
Empty output here is a silent killer: the collector will start up perfectly fine and then throw AccessDenied only when it tries to export. The startup logs look clean either way — so check the annotation explicitly.
Step 5 — Confirm the collector is actually running
kubectl get opentelemetrycollector -n adot
kubectl get pods -n adot
kubectl logs -n adot deploy/adot-collector -f
The line you're looking for:
service@v0.151.0/service.go:264 Everything is ready. Begin running and processing data.
Plus both OTLP receivers listening ([::]:4317 gRPC, [::]:4318 HTTP) and the memory_limiter configured. A couple of warnings are normal and ignorable:
found no extra config, skip it ... extracfg.txt: no such file— that file is optionalawsemf DimensionRollupOption will be changingand thedatadog/signalfxnotices — future-release heads-ups, nothing to do with your config
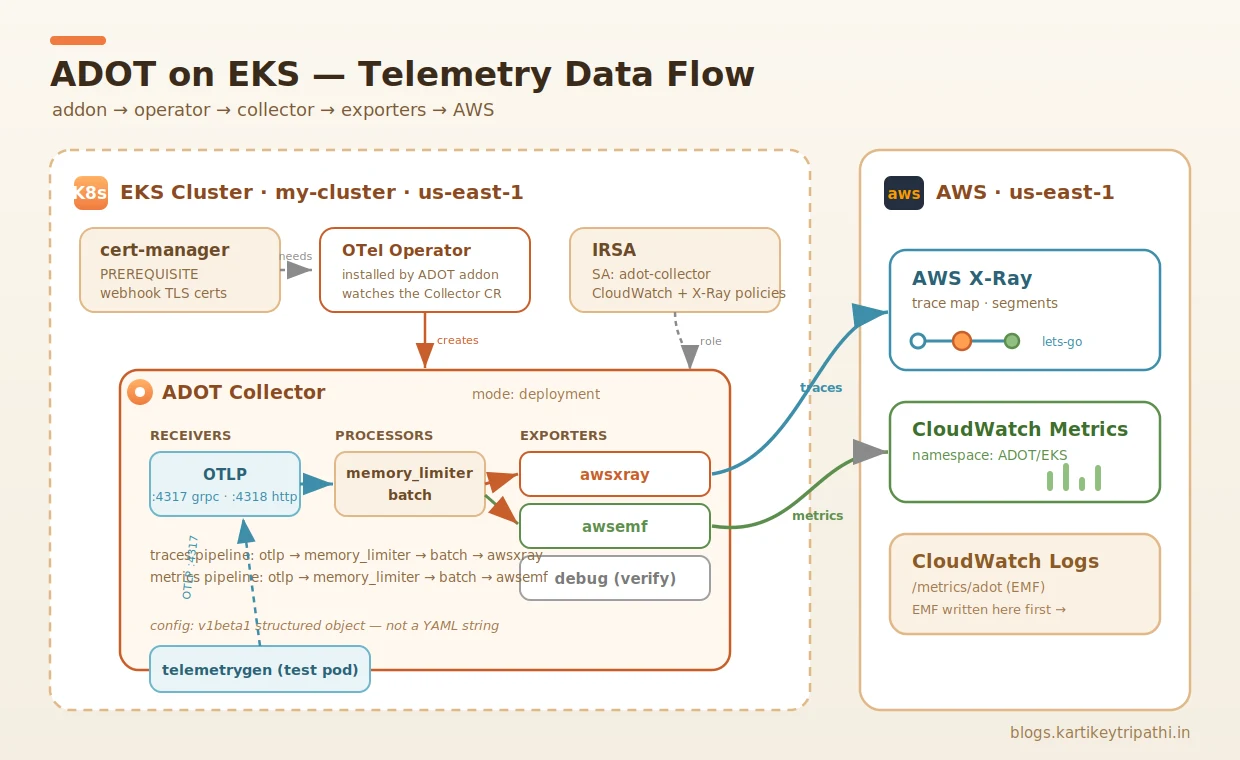
Here's the full picture of what's now running in the cluster and where the data is destined to go:
Step 6 — The scheduling failure that isn't about CPU
Time to send test data. The OpenTelemetry project ships telemetrygen, which fires synthetic spans/metrics at an OTLP endpoint. I ran it as a one-off pod — and hit a wall.
First, a smaller lesson: don't use --rm -it for telemetrygen. It finishes near-instantly, and the interactive attach races the pod deletion:
pod "telemetrygen" deleted from default namespace
error: timed out waiting for the condition
Drop -it, let the pod stick around, read its logs, then delete it. Fine. But the real wall came next — the pod sat Pending:
kubectl describe pod telemetrygen -n adot | tail -30
Warning  FailedScheduling  default-scheduler
  0/1 nodes are available: 1 Too many pods.
Too many pods is not a CPU or memory problem. On EKS, the VPC CNI gives every pod a real VPC IP, and each instance type supports a fixed number of ENIs × IPs — which sets a hard max-pods-per-node ceiling. My single node had simply run out of pod slots.
Check the ceiling and current usage:
# max pods this node allows
kubectl get node -o jsonpath='{.items[0].status.allocatable.pods}'; echo

# how many are already scheduled on it
kubectl get pods -A --field-selector \
  spec.nodeName=$(kubectl get nodes -o jsonpath='{.items[0].metadata.name}') \
  --no-headers | wc -l
For reference, the default density caps by instance type:
| Instance | Max pods (default CNI) | vCPU / RAM |
|---|---|---|
| t3.micro | 4 | 2 / 1 GB |
| t3.small | 11 | 2 / 2 GB |
| t3.medium | 17 | 2 / 4 GB |
This is also why "just use smaller/cheaper nodes" can backfire — a t3.micro gives you 4 pod slots, and aws-node + kube-proxy DaemonSets eat into that immediately, leaving ~2 usable. For density, smaller is worse.
Fixing it
The cleanest fix on an existing nodegroup is to add a node. But my first scale attempt was itself blocked:
eksctl scale nodegroup --cluster my-cluster --name workers --nodes 2 --region us-east-1
InvalidParameterException: desired capacity 2 can't be greater than max size 1
The nodegroup's max size was 1. You can't scale desired past the ASG ceiling — so raise the max in the same command:
eksctl scale nodegroup \
  --cluster my-cluster \
  --name workers \
  --nodes 2 \
  --nodes-max 4 \
  --region us-east-1
[ℹ] initiated scaling of nodegroup
Wait for the second node to join:
kubectl get nodes -w
Longer-term fix: if you keep hitting density limits, enable prefix delegation on the VPC CNI (
ENABLE_PREFIX_DELEGATION=trueon theaws-nodeDaemonSet). It assigns /28 prefixes instead of individual IPs and multiplies the per-node pod cap — but it needs a node recycle and a matching kubeletmax-podsto take effect. For a quick test cluster, just scaling out is enough.
Step 7 — Send telemetry and watch it flow
With two nodes Ready, telemetrygen schedules onto the free slots:
kubectl run telemetrygen -n default --restart=Never \
  --image=ghcr.io/open-telemetry/opentelemetry-collector-contrib/telemetrygen:latest -- \
  traces --otlp-endpoint adot-collector.adot.svc.cluster.local:4317 \
  --otlp-insecure --traces 10
sleep 20 && kubectl logs telemetrygen -n default
The send-side log tells the story cleanly:
Channel Connectivity change to READY        # connected to 10.100.6.30:4317
traces generated   {"worker": 0, "traces": 10}
stopping the exporter
READY against the collector's service IP, ten traces generated, clean shutdown. The OTLP path works.
Endpoint naming tip: the operator names the service
<CR-name>-collector. My CR was namedadot, so the service isadot-collectoron ports4317/4318. If your connection refuses, runkubectl get svc -n adotand match the name exactly.
Step 8 — Prove it landed (don't just assume)
This is the step people skip, and it's the only one that actually matters. telemetrygen showing "10 traces generated" only proves the send side. It says nothing about whether the collector received them, or whether the awsxray exporter successfully pushed them to AWS.
Two ways to confirm. First, the collector's own logs (the debug exporter at detailed verbosity prints every span that passes through):
kubectl logs -n adot deploy/adot-collector --since=5m \
  | grep -iE 'ResourceSpans|telemetrygen|spans|error|denied|xray'
You want ResourceSpans blocks with service.name: Str(telemetrygen) and no AccessDenied. If you see spans but also AccessDenied, ingest works and the IRSA export permission is missing — back to Step 4.
Then the real proof — the X-Ray console (CloudWatch → Traces, us-east-1):
The trace map showed exactly what telemetrygen produces by default: Client → lets-go → telemetrygen, both segments green at Ok 100%. The segment metadata confirmed it was genuinely my test data and not stray traffic:
"default": {
  "service.peer.name": "telemetrygen-server",
  "otel.resource.service.name": "telemetrygen"
}
A successful awsxray export also implicitly confirms IRSA is correctly wired — if the SA lacked X-Ray permissions, the export would have failed with AccessDenied and nothing would have reached the console.
You can do the same check from the CLI:
aws xray get-trace-summaries \
  --region us-east-1 \
  --start-time $(date -u -d '10 minutes ago' +%s) \
  --end-time $(date -u +%s) \
  --query 'length(TraceSummaries)'
Anything > 0 means traces landed.
The full path, in one place
| Stage | What it does | The trap |
|---|---|---|
| Addon version | describe-addon-versions → create-addon | Hard-coded versions aren't valid across K8s minors |
| cert-manager | Install + wait for all 3 pods ready | Addon won't install it; webhook needs to be reachable |
| Collector CR | v1beta1 + structured config (no |) | v1alpha1 string config is rejected on unmarshal |
| IRSA | SA with CloudWatch + X-Ray policies | Missing perms fail silently — only at export, not startup |
| Verify running | Everything is ready... in logs | — |
| Scheduling | Scale nodegroup to add a node | Too many pods = IP/ENI density, not CPU |
| ASG ceiling | Pass --nodes-max when scaling | desired can't exceed max size |
| Send data | telemetrygen, no --rm -it | Interactive attach races pod deletion |
| Verify landed | Collector logs + X-Ray console | "traces generated" only proves the send side |
Wrapping up
The ADOT addon itself is genuinely a few commands. What makes the setup feel like a fight is that the failures are spread across four completely different layers — IAM (IRSA), a CRD schema migration (v1alpha1 → v1beta1), the VPC CNI's IP-based pod density, and the ASG max-size ceiling — and each one throws an error that points somewhere other than the real cause. The Too many pods error doesn't mention IPs. The unmarshal error doesn't say "use v1beta1." The clean collector startup doesn't warn you that IRSA is missing.
Knowing the map ahead of time turns a frustrating afternoon into about fifteen minutes. Install cert-manager and wait for it. Use v1beta1 with a structured config. Wire IRSA and verify the annotation. Watch your pod density. And never trust "data sent" — always confirm "data landed" in X-Ray.
Next up I'll exercise the metrics pipeline — the awsemf exporter pushing into the CloudWatch ADOT/EKS namespace and the /metrics/adot log group — and wire in real Container Insights instead of synthetic telemetry. That's a post of its own.
Found this useful? I write about EKS internals, Kubernetes networking, and the AWS Containers stack at blogs.kartikeytripathi.in.